
Data FoundationTM for Portfolio Lenders
Data Foundation Dashboard
Connect to the Most Comprehensive, Mature CRE Risk Analytics Platform in the Industry
CRE lenders rely on the CoStar Risk Analytics’ Data FoundationTM. We integrate industry-leading CRE data, research and market analytics, the Compass mature credit default model, and over 400 fields, all mapped directly to each property within a lender’s portfolio onto a single platform.
Data Foundation Key Capabilities
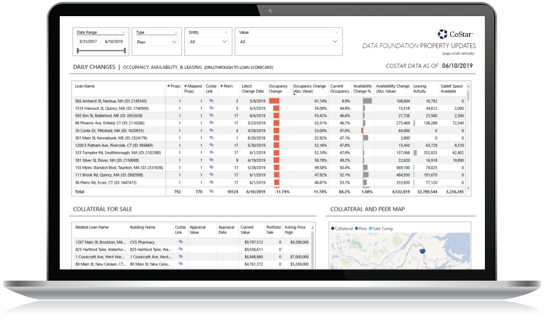
Monitor Your CRE Collateral in Real Time
- Your portfolio's CRE collateral is monitored across the entire CoStar ecosystem in real time, delivering all changes to your desktop daily. Know and react to changes that impact your portfolio's performance immediately
- Peers, sale comps and for-sale properties relevant to your portfolio are constantly monitored
- Over 100 fields of data are monitored for changes and delivered to you daily, including occupancy, availability, sublets, tenants, for-sale asking prices and leasing activity
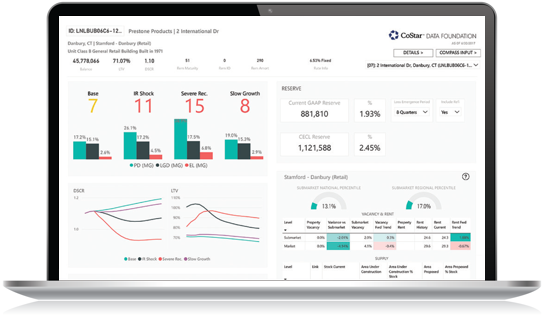
CECL and Stress Testing
- The CoStar Compass Credit Default model is the most mature in the industry. For over 15 years, it's been relied upon to determine probability of default, loss given default and expected loss through the loan term as well as at maturity
- The model is CECL-compliant and allows you to customize using macroeconomic scenarios
- The model is calibrated using more than 33 years of default history and is back-tested quarterly for accuracy
- Because it is independently validated for accuracy and standards, the model provides you transparency to ensure adequate validation for regulatory examination support and reporting
- CoStar offers a highly customizable stress testing solution for any size bank; it can be used for CCAR/DFAST
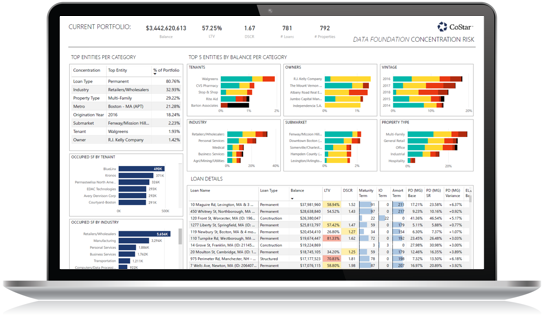
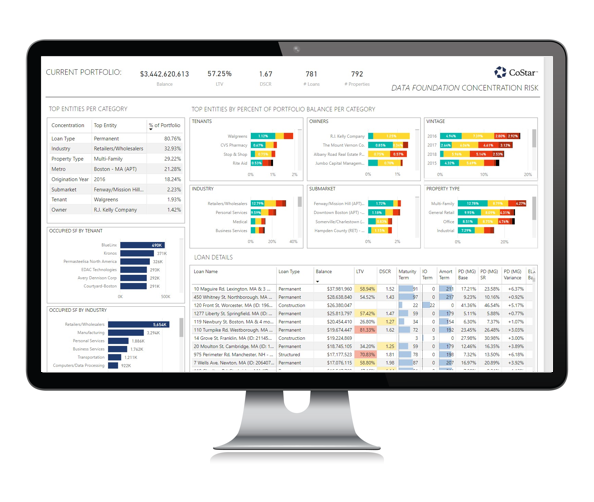
Analyze Your Portfolio’s Concentration Risk Like Never Before
- Advanced data integrity technology with analyst support cleanses your portfolio's data, automatically making each LTV and DSCR in your portfolio current, allowing for more timely and accurate analysis
- Our interactive concentration risk dashboard allows you to quickly identify and drill down on areas of distress, helping you understand your level of exposure to advise on target lending and loan diversification strategies
- With three clicks, you can go from portfolio results, to loan-level results, to property-level research, allowing you to show the drivers of risk at the most granular level
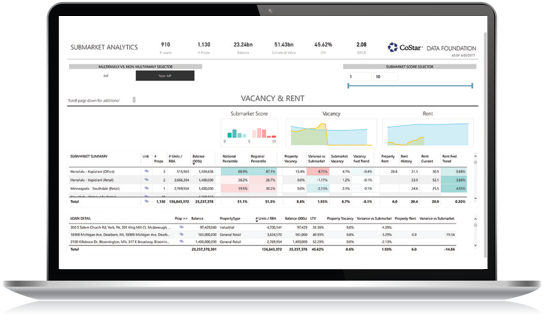
See Market Trends Emerge and Formulate the Best Response Before the Impact is Fully Felt
- Compare your portfolio's loan details and performance to the industry for each metro and submarket. CoStar's Market Analytic Forecasts cover all 390 CBSAs, 10,000+ submarkets and 42,639 zip codes for each of the five property types: office, multifamily, hospitality, industrial (warehouse) and retail
- Assess your portfolio with CoStar's submarket and national vacancy and rental analytics
- View vacancy and supply information, including proposed and under construction data


